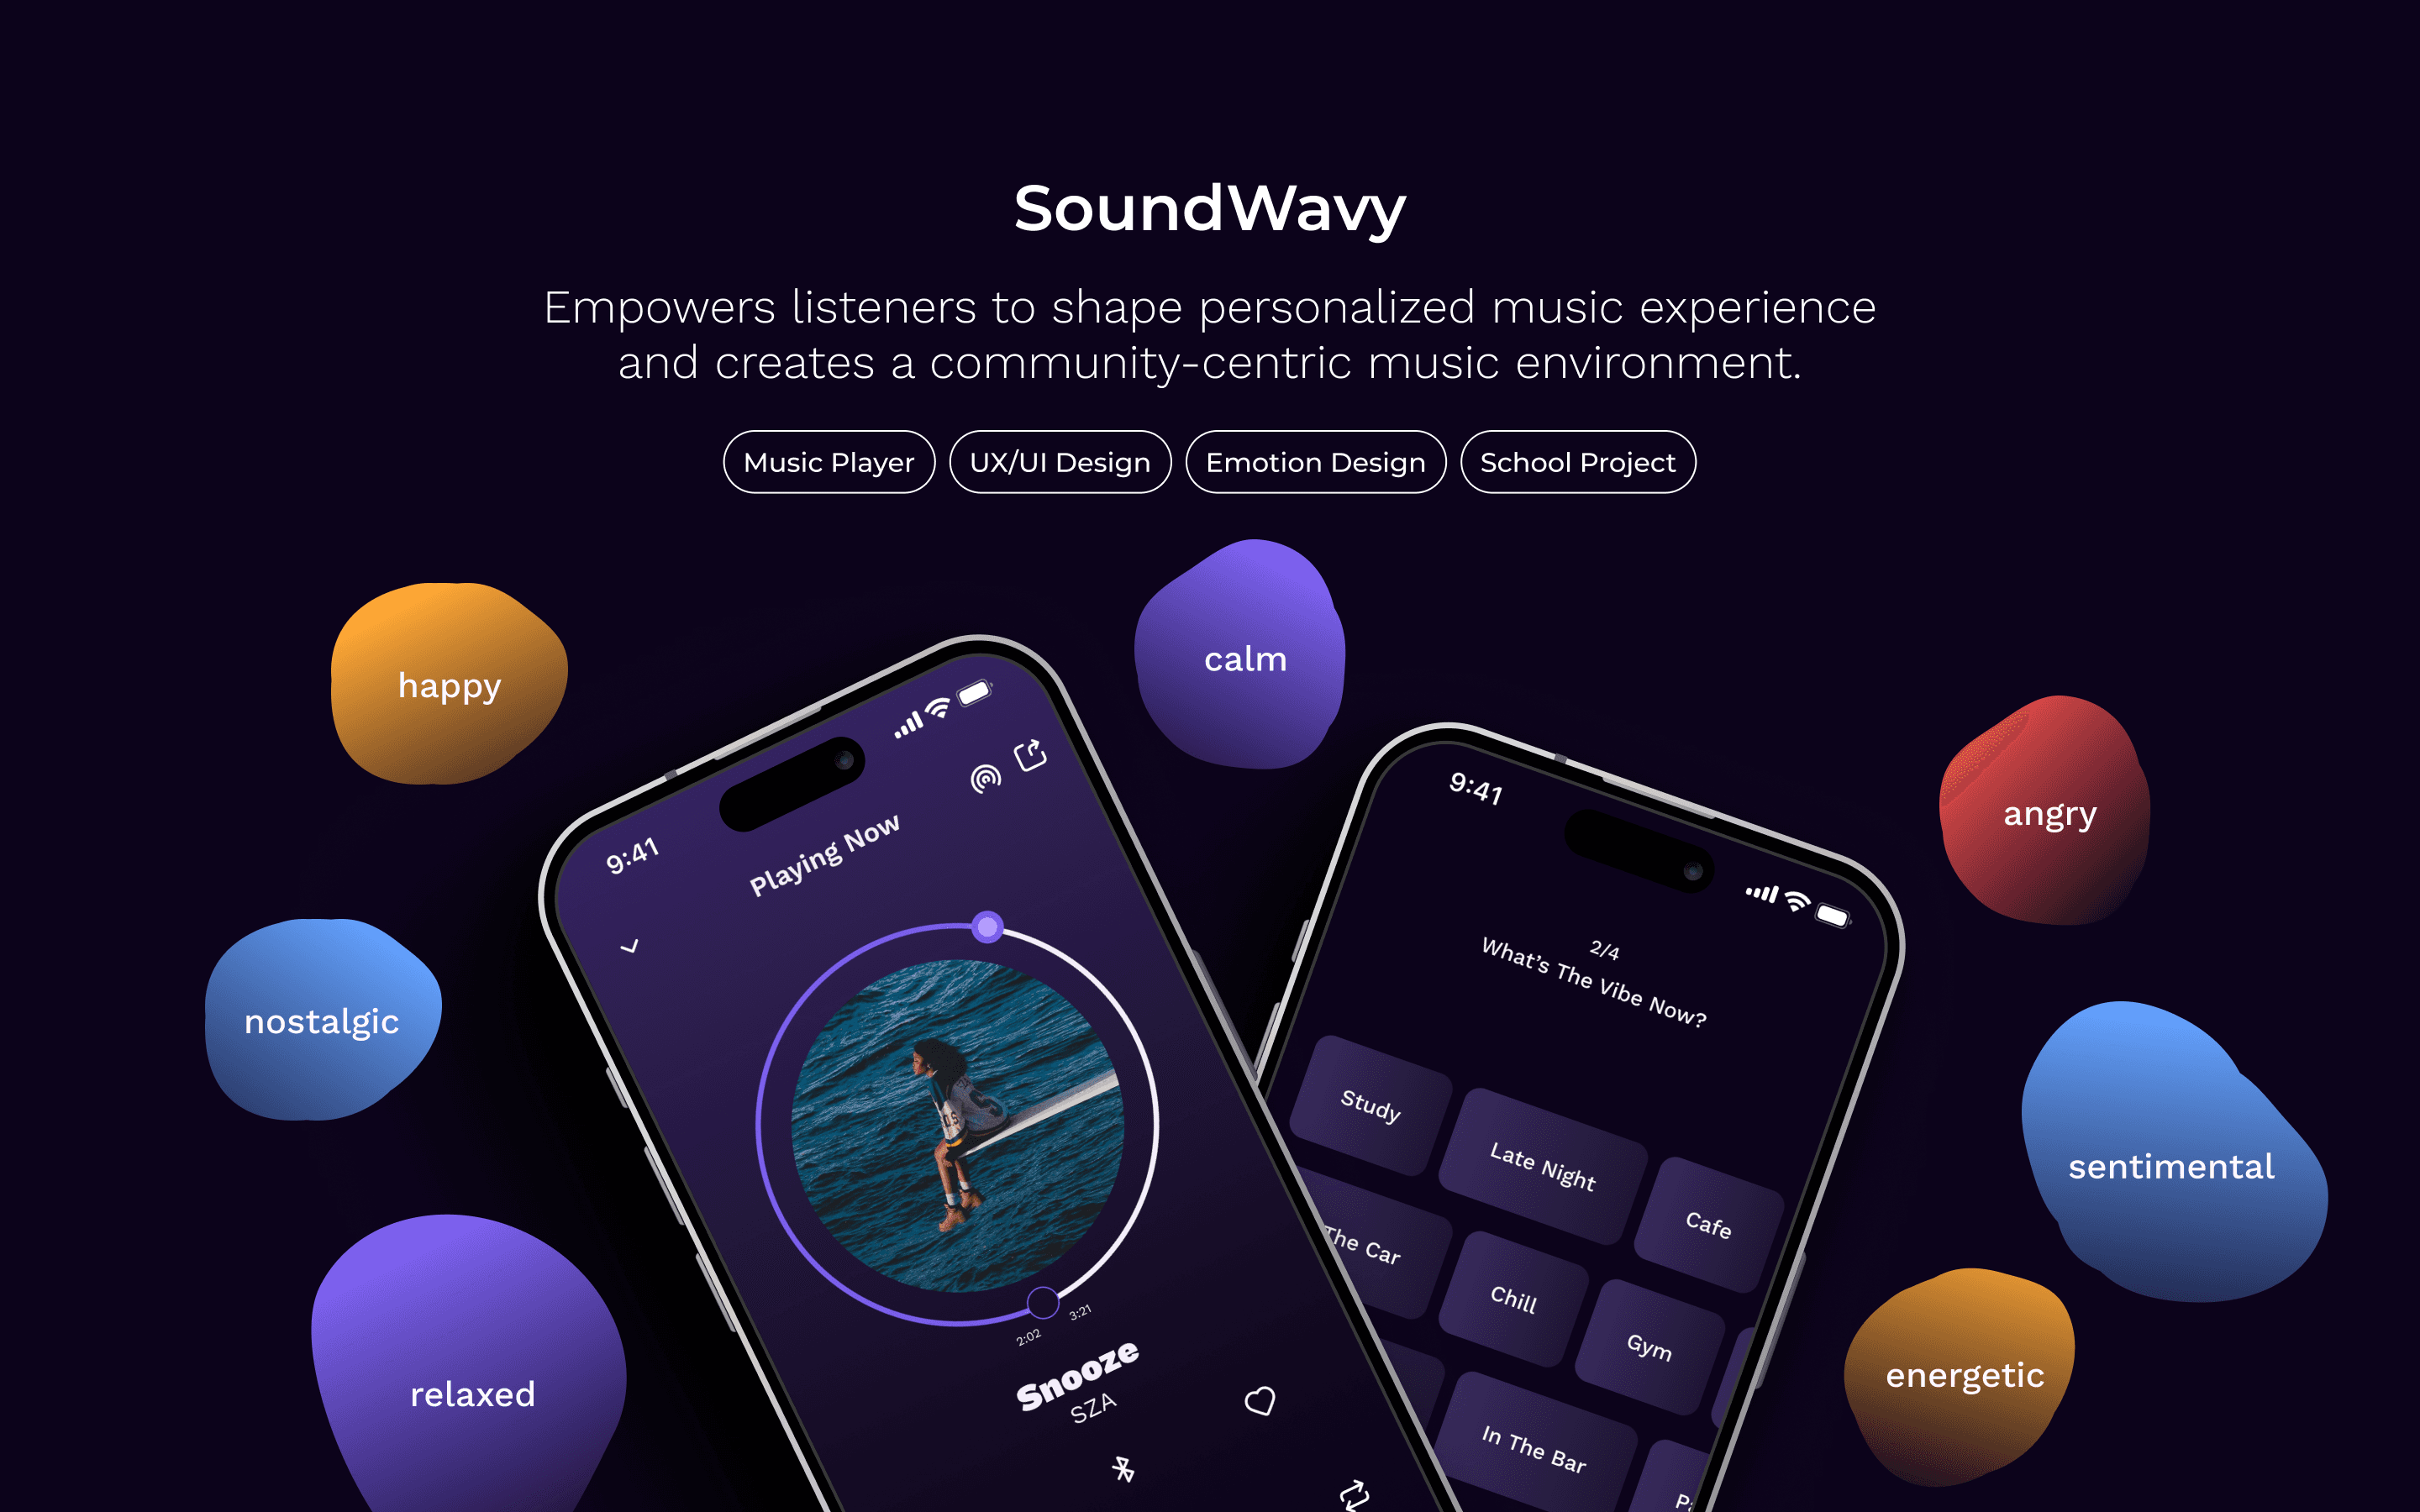
SoundWavy is an emotion-based music player that enhances casual listeners' personalized listening experience and fosters a community-centric music environment for social listeners.
Team
Clemens Chen
(Self-project)
Role
UX Researcher
UI Designer
Topics
Emotion Design
UX/UI Design
Music Player
Timeline
8 Weeks
(UW School Project)
Design Inspiration
Design Outcomes
A music player harnessing music’s innate capacity in emotions to
Research
I investigated current main music players and conducted surveys on how users think about their music players.
Competitive Analysis
I conducted a competitive analysis of three leading music players: Spotify, Apple Music, and SoundCloud. This analysis examined each platform’s strengths and pain points across three key perspectives—needs, usability, and aesthetics.
User Profiles
We engaged 3 subject experts to provide context, guidance, and specialized knowledge to inform our research design and interpretation of findings.
2
flight controllers at NASA
1
researcher on "sleep in Space"
1
hour for each interview
Semi-Structured Interview
Since direct access to astronauts for our study was restricted, we adopted an analogous research method: we recruited participants from analogous environments on Earth. We identified user groups whose work related conditions and challenges most closely overlapped with those faced by astronauts.

Ideation
How might we help end users gain actionable insights from financial data, simplify data entry across various departments, and improve the efficiency of budget review tracking?
Design Principle
01
Seamless Adoption
Design intuitive, easy-to-navigate interfaces that require minimal training, ensuring quick and smooth adoption across departments and subsidiaries.
02
Customization
Allow users to customize views and filters based on their department or subsidiary, making the system adaptable to various roles and needs.
03
Transparency
Ensure clear visibility at each stage, allowing users to easily track progress and understand who is responsible for each step.
04
Data Security
Implement robust measures to protect sensitive financial data, ensuring compliance with industry security standards and maintaining user trust.
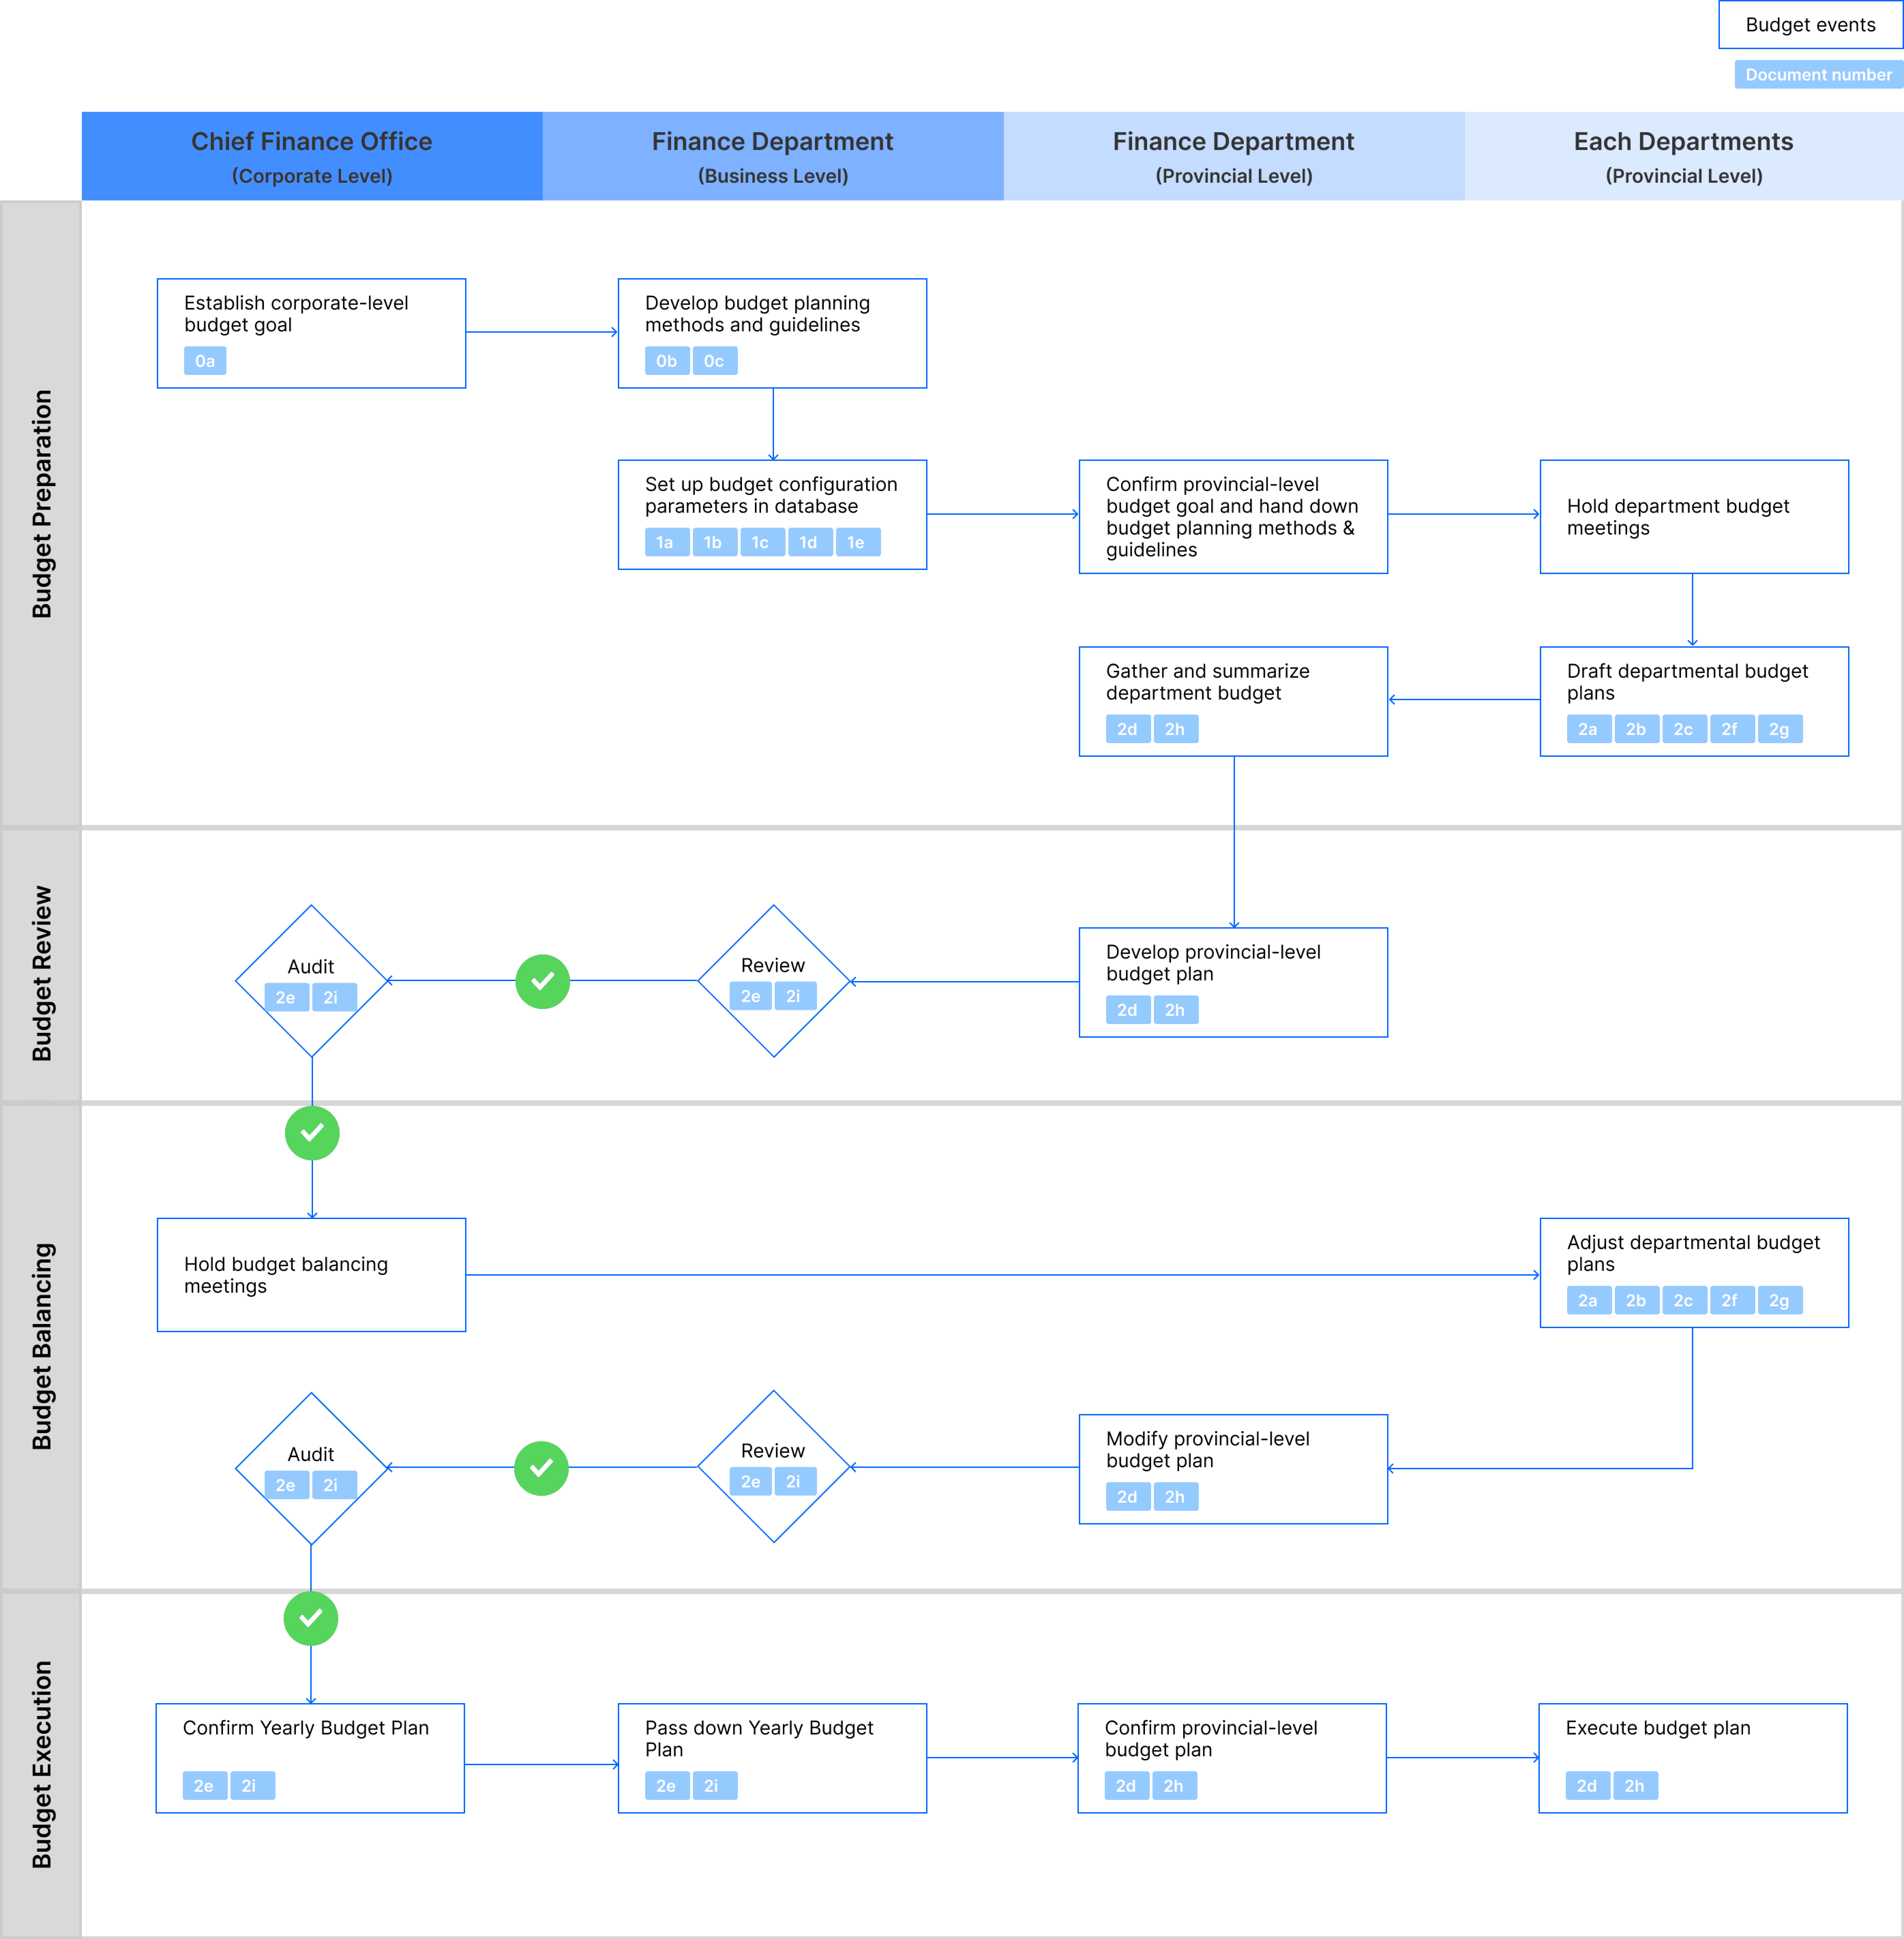
Process Mapping
Based on insights gathered from interviews and document analysis, I developed a comprehensive process map detailing the current workflow for budget plan submission, review, and approval. This visual representation highlights key steps and decision points across different organizational levels, providing clarity on the overall process and identifying areas for potential improvement.
Information Architecture
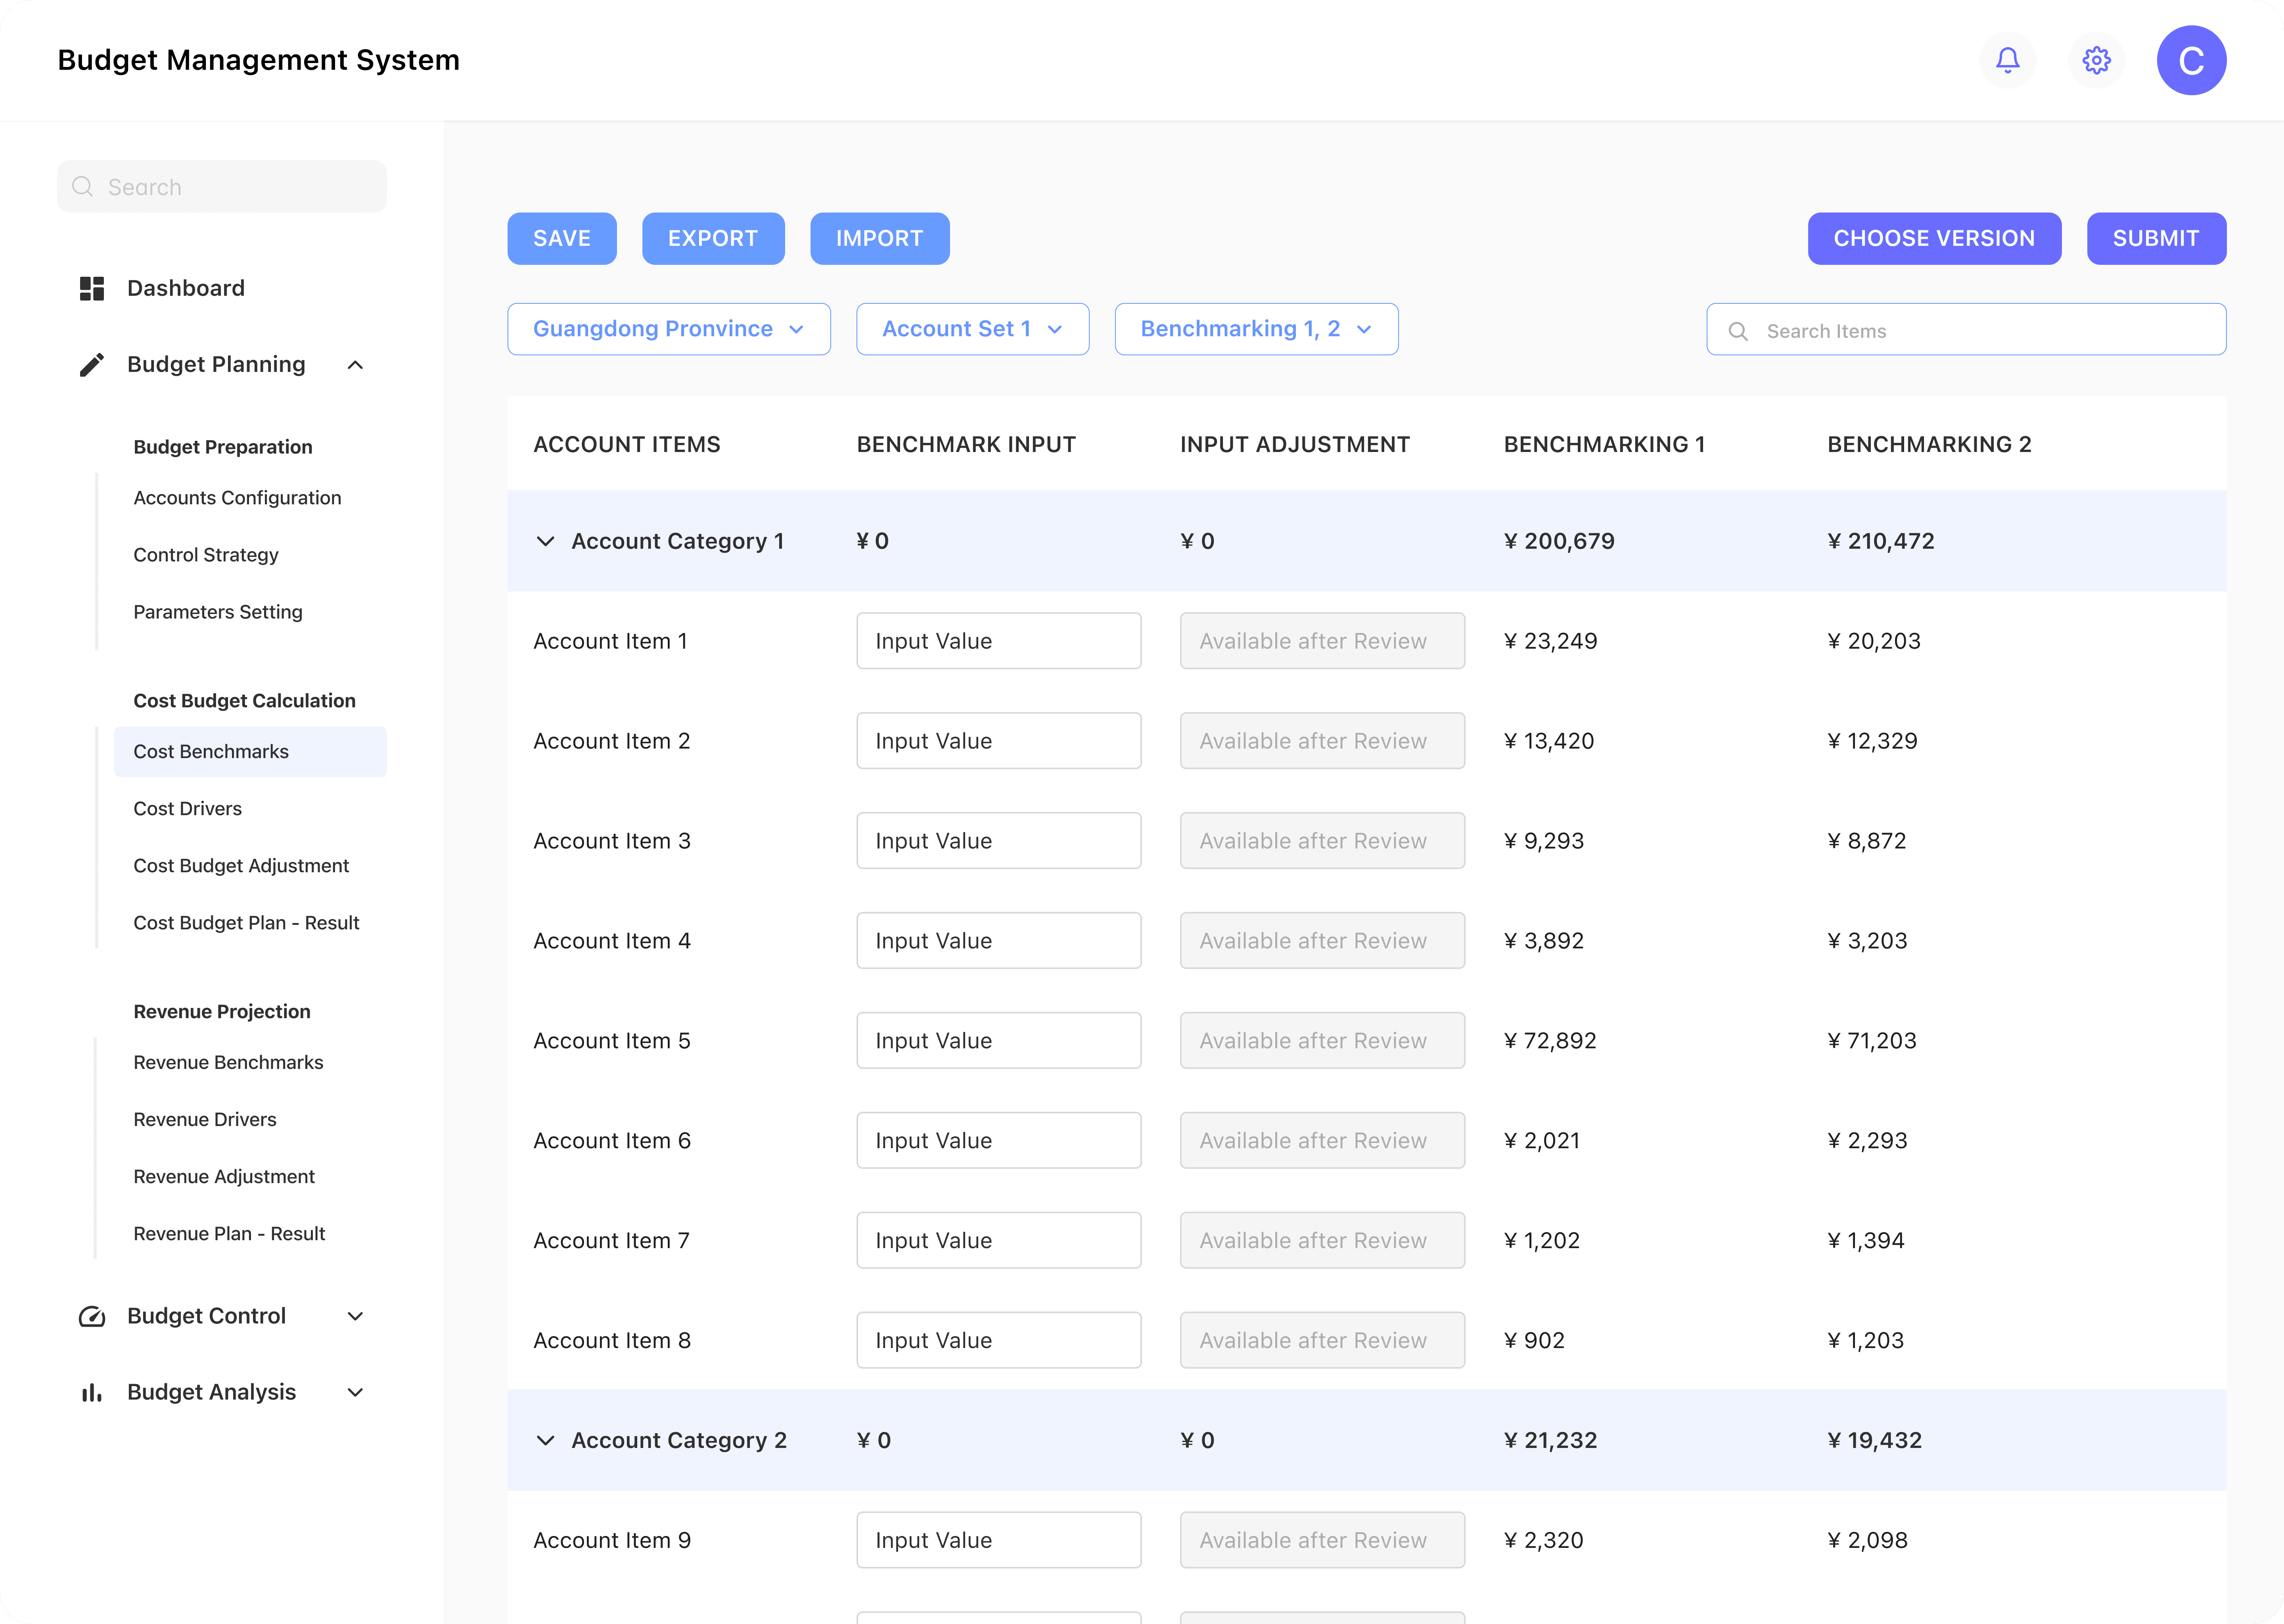
I crafted the information architecture for the budget management system with a focus on the Cost Budget Planning feature. The goal was to create a clear, intuitive structure that would allow users to easily navigate and manage key tasks. By organizing the system around user needs and key functions, I ensured that the architecture was scalable and adaptable, supporting various departments and subsidiaries across the organization.

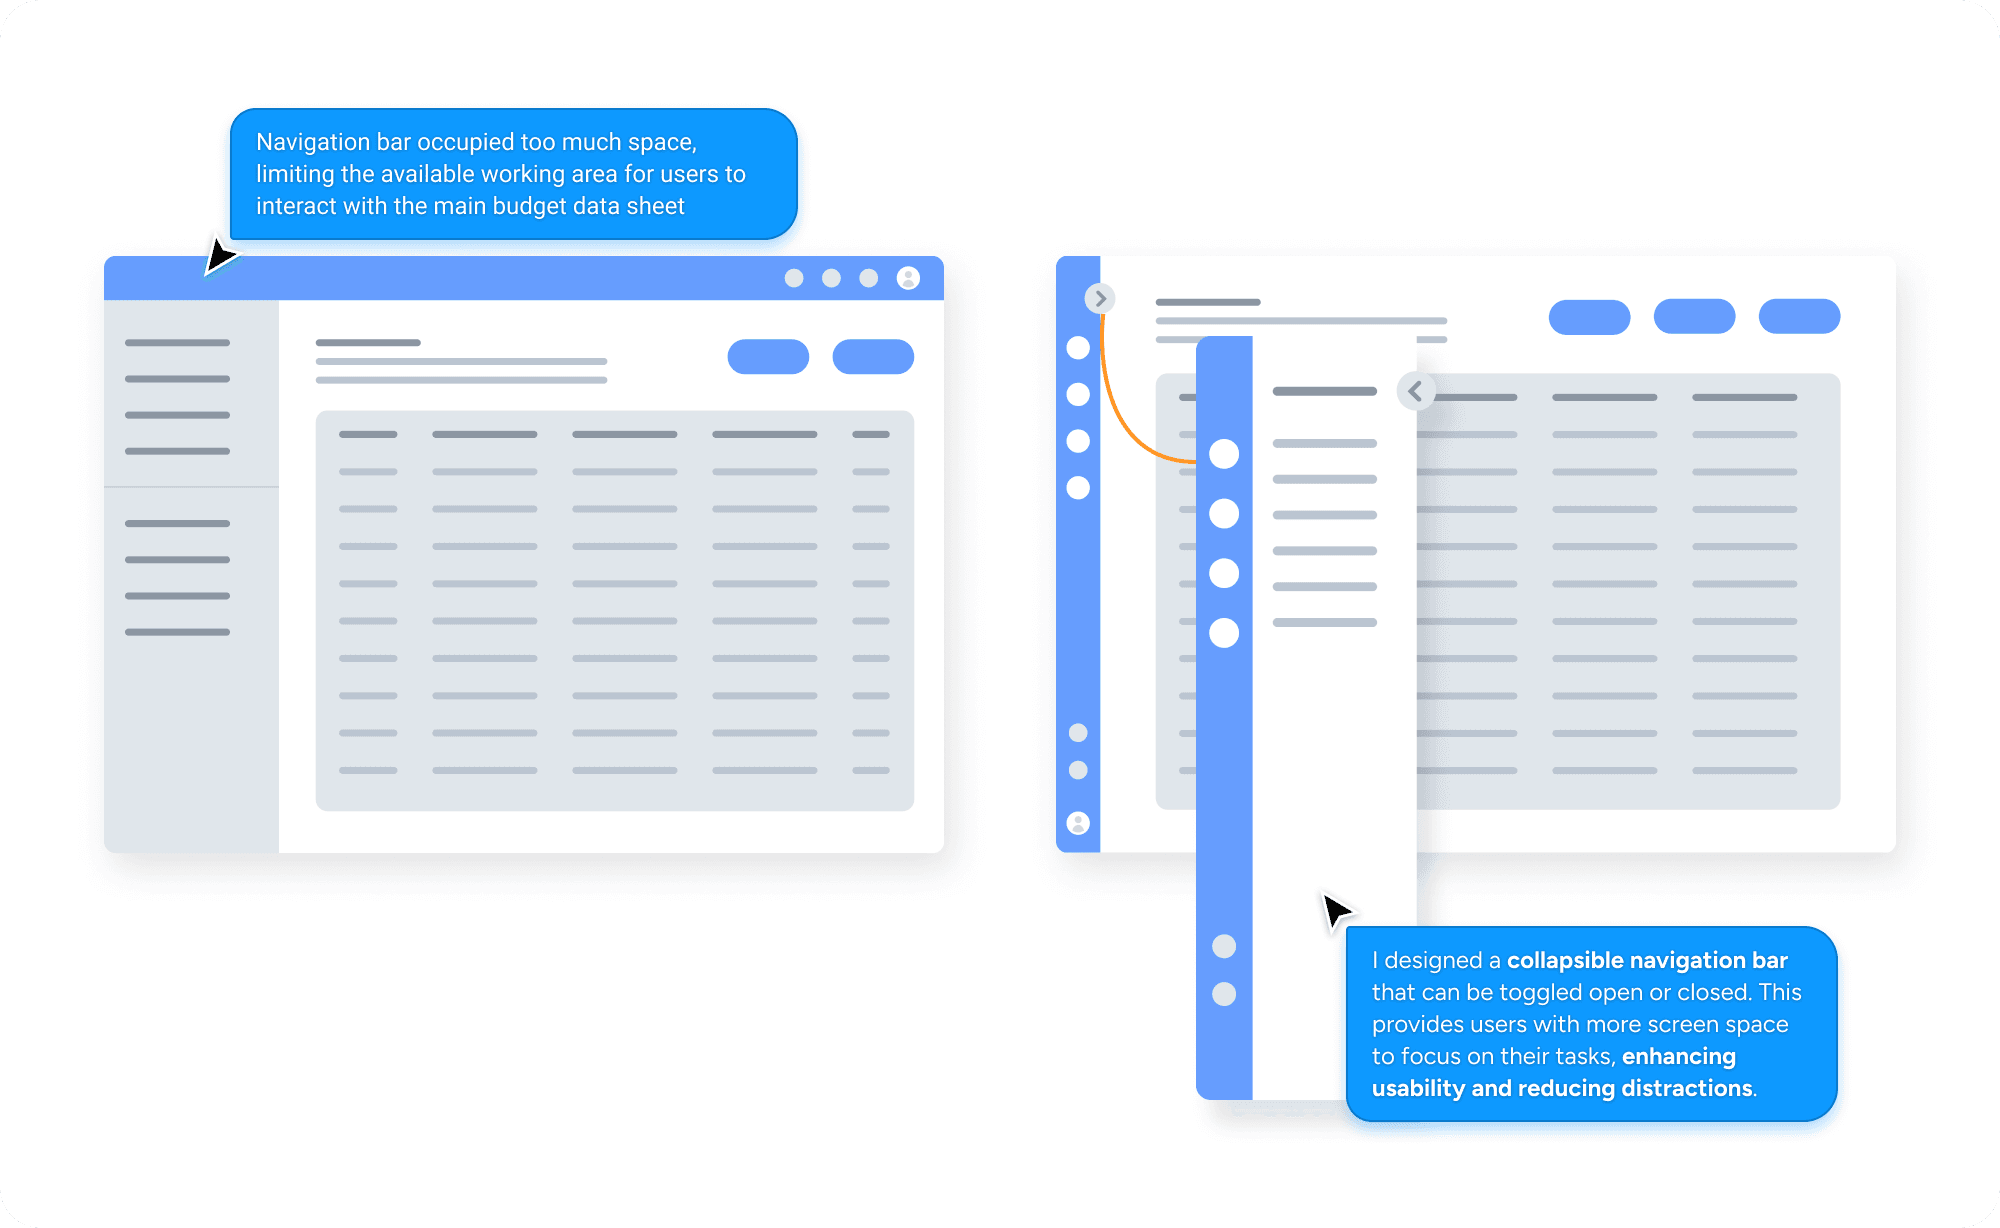
Layout Design
We started our design with the general layout of the budget management system. Since from research we found that users using the main working area most of the time, I purposed a collapsible navigation bar which allows users to have more focus on the budget data sheet.
Implementation
We collaborated with the in-house development team to turn the design into a technically tangible solution.
Align Business Terms with System Language
During testing, I discovered a mismatch between the selected organizational level and the displayed data. After investigating with the development team, we identified a communication gap: my Product Required Documents (PRD) used business terms, while developers worked with their own terminology. This caused misinterpretations, leading to delays and errors in development.
To resolve this, I initiated detailed sessions with the development team to align our terminology and updated the PRDs to match their system language. This significantly improved communication and streamlined the development process, reducing unnecessary rework.
Adapting Design to Technical Constraints
Another challenge arose with implementing a dynamic data entry table for historical reference data. Given the technical constraints and project timeline, we needed an alternative solution.
Rather than delay the project, I collaborated with the development team to create a workaround—making historical data a selectable parameter for table generation. This allowed users to choose specific years for relevant historical data, ensuring we met the project deadline without sacrificing functionality.
Iteration
We tested the initial prototype and iterated based on users' feedback.
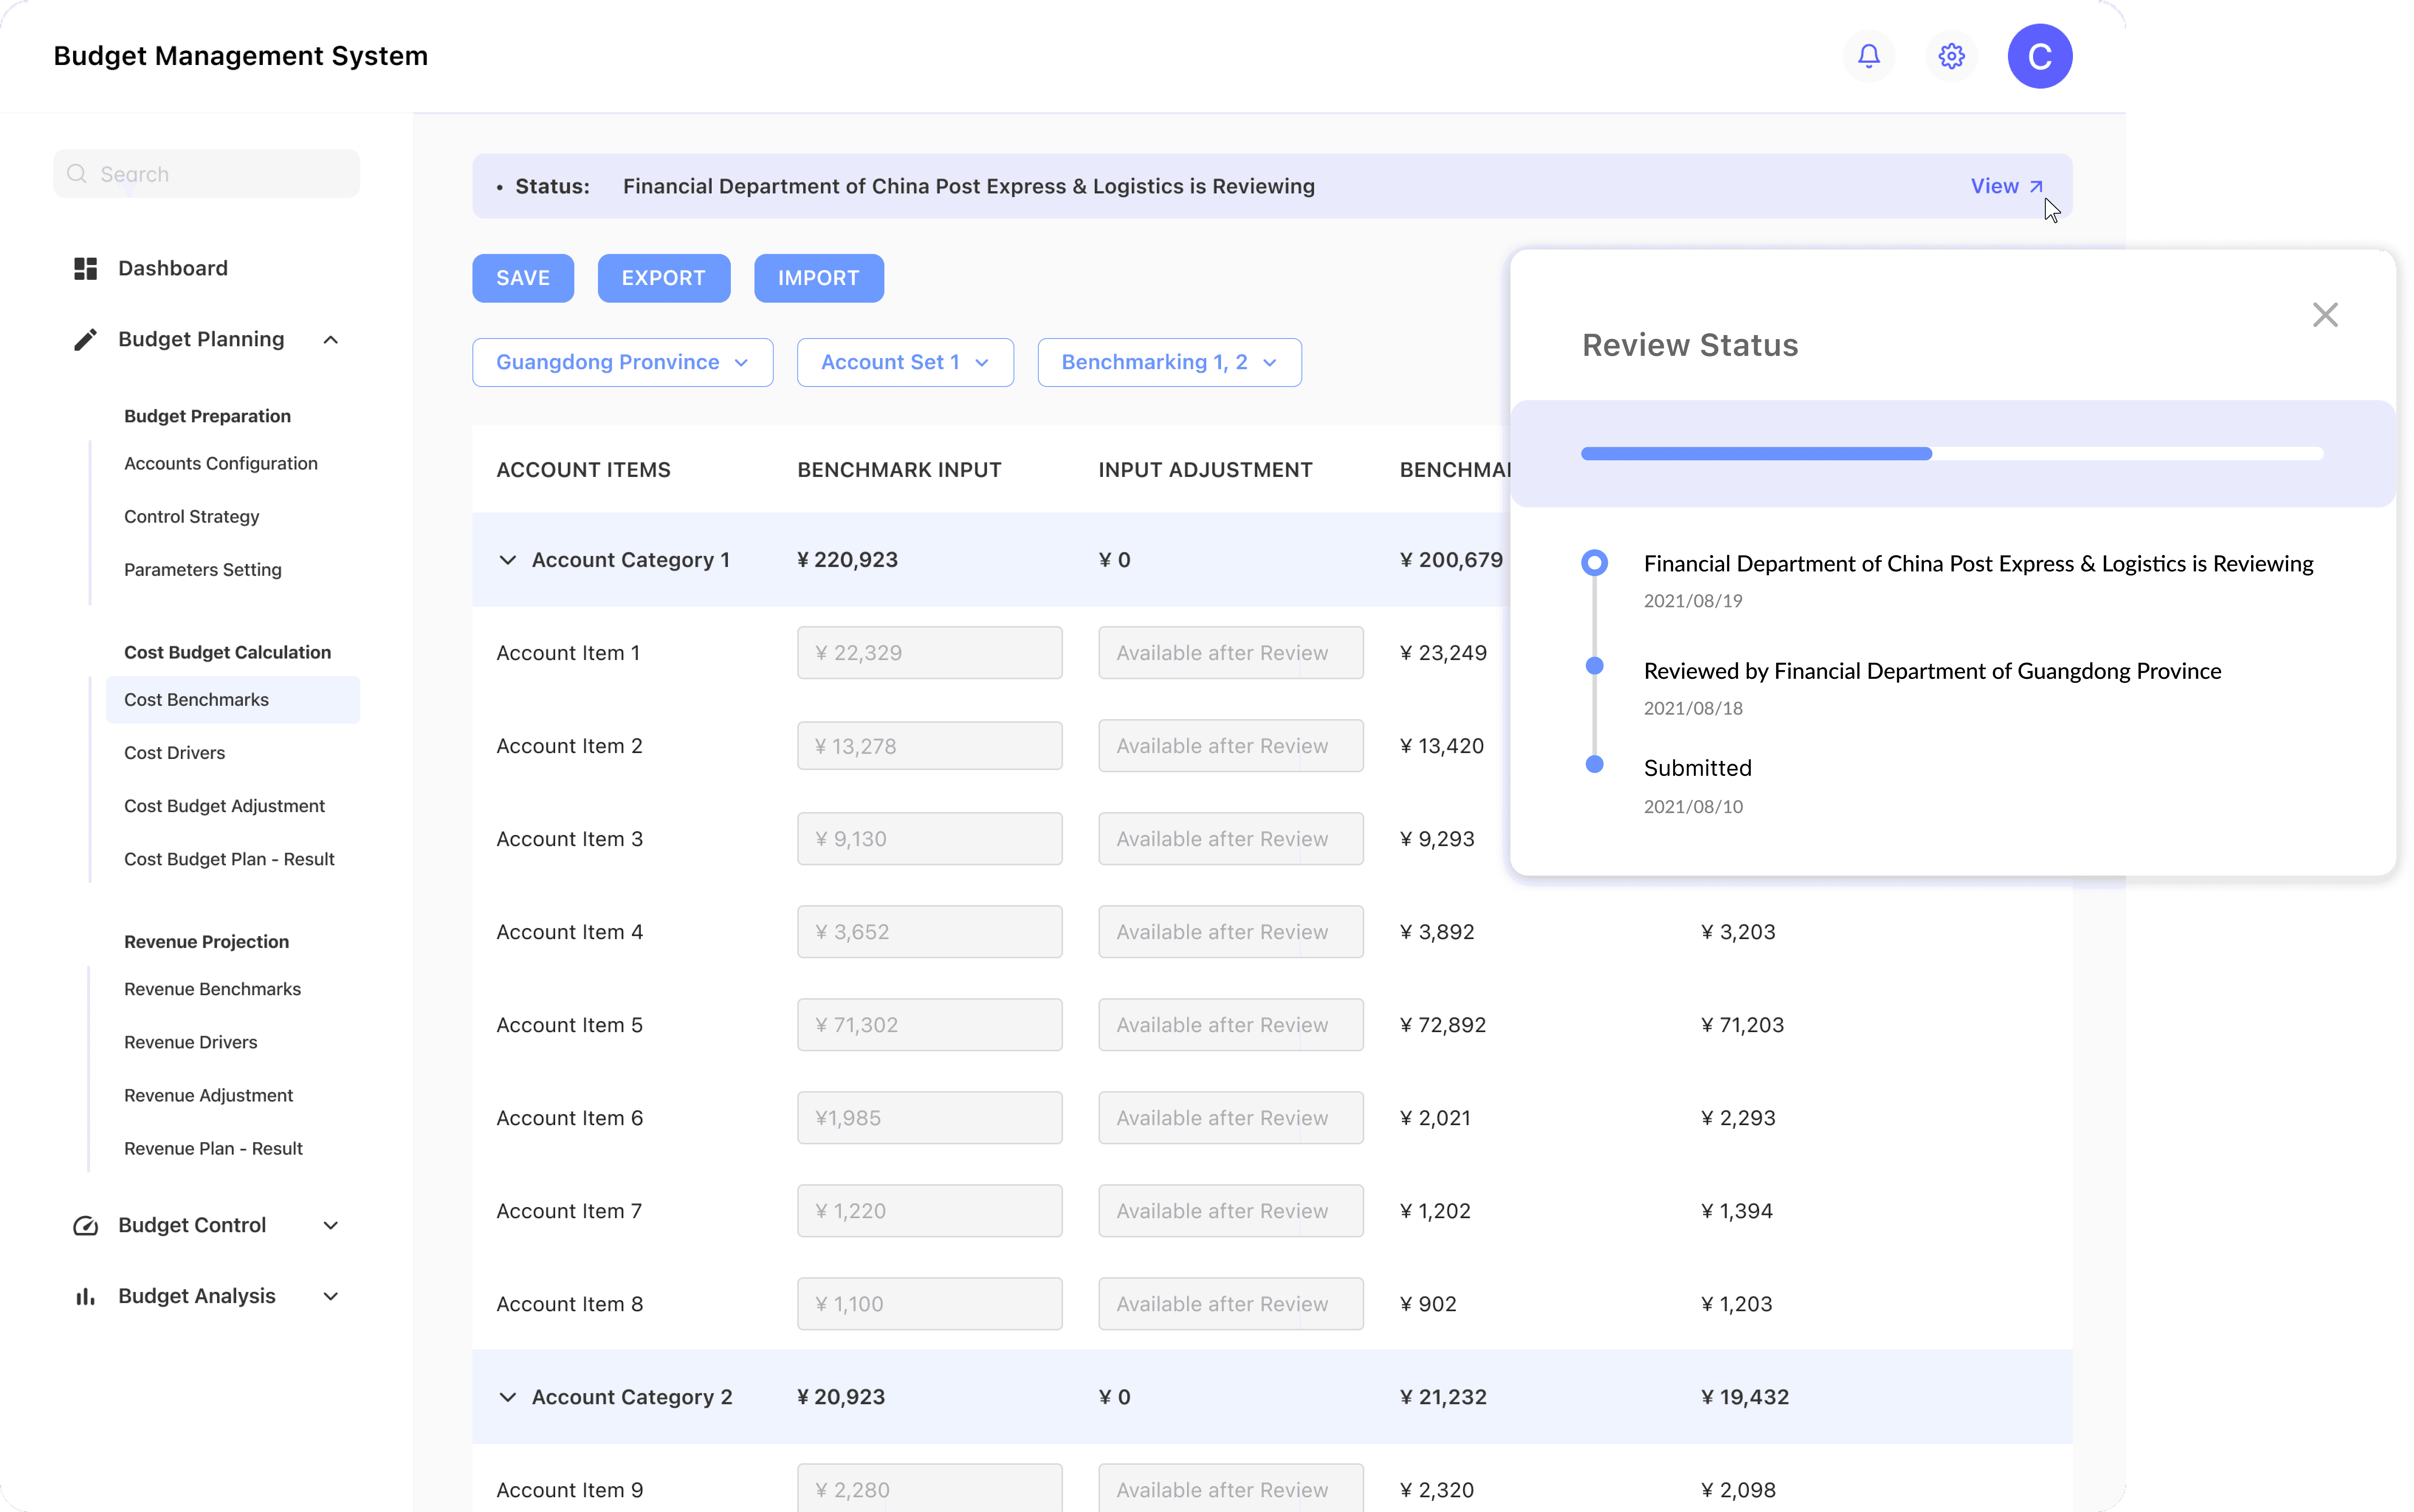
UA Testing
Over the course of one week, We tested the prototype with over 100 budget managers from 31 provinces. The participants interacted with the system, performing typical budgeting tasks and providing valuable insights into the user experience, functionality, and potential areas for improvement.
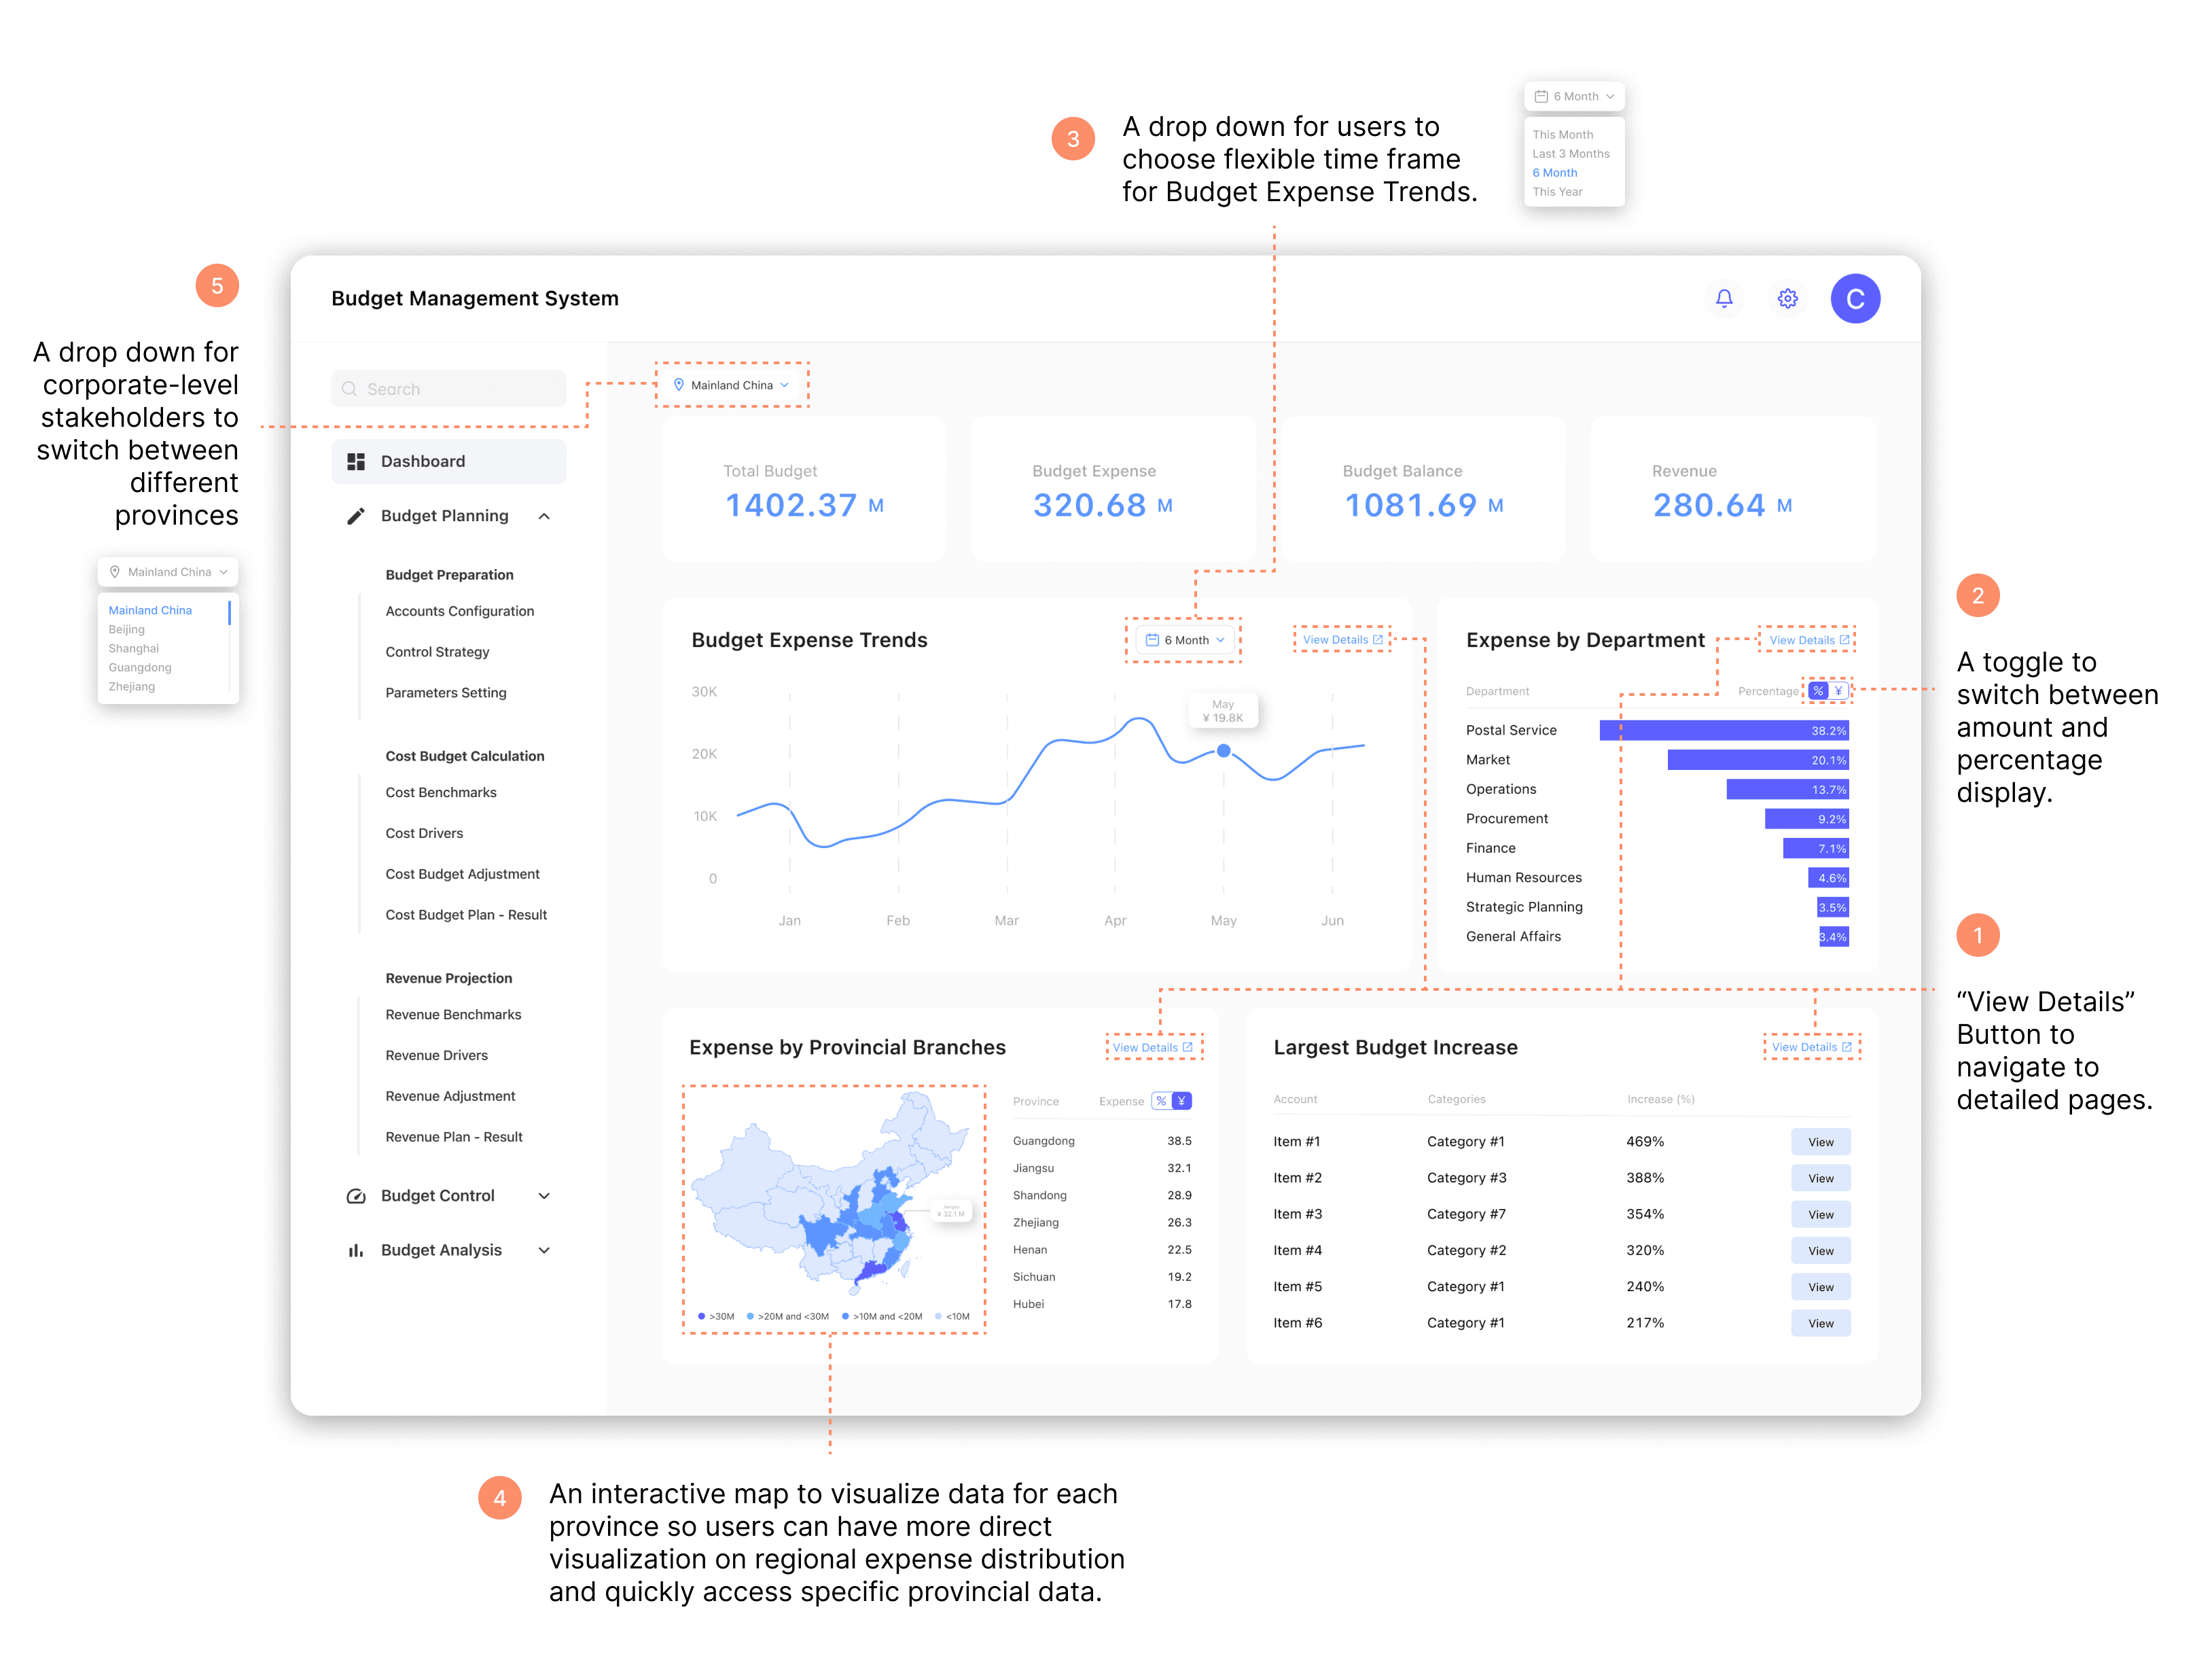
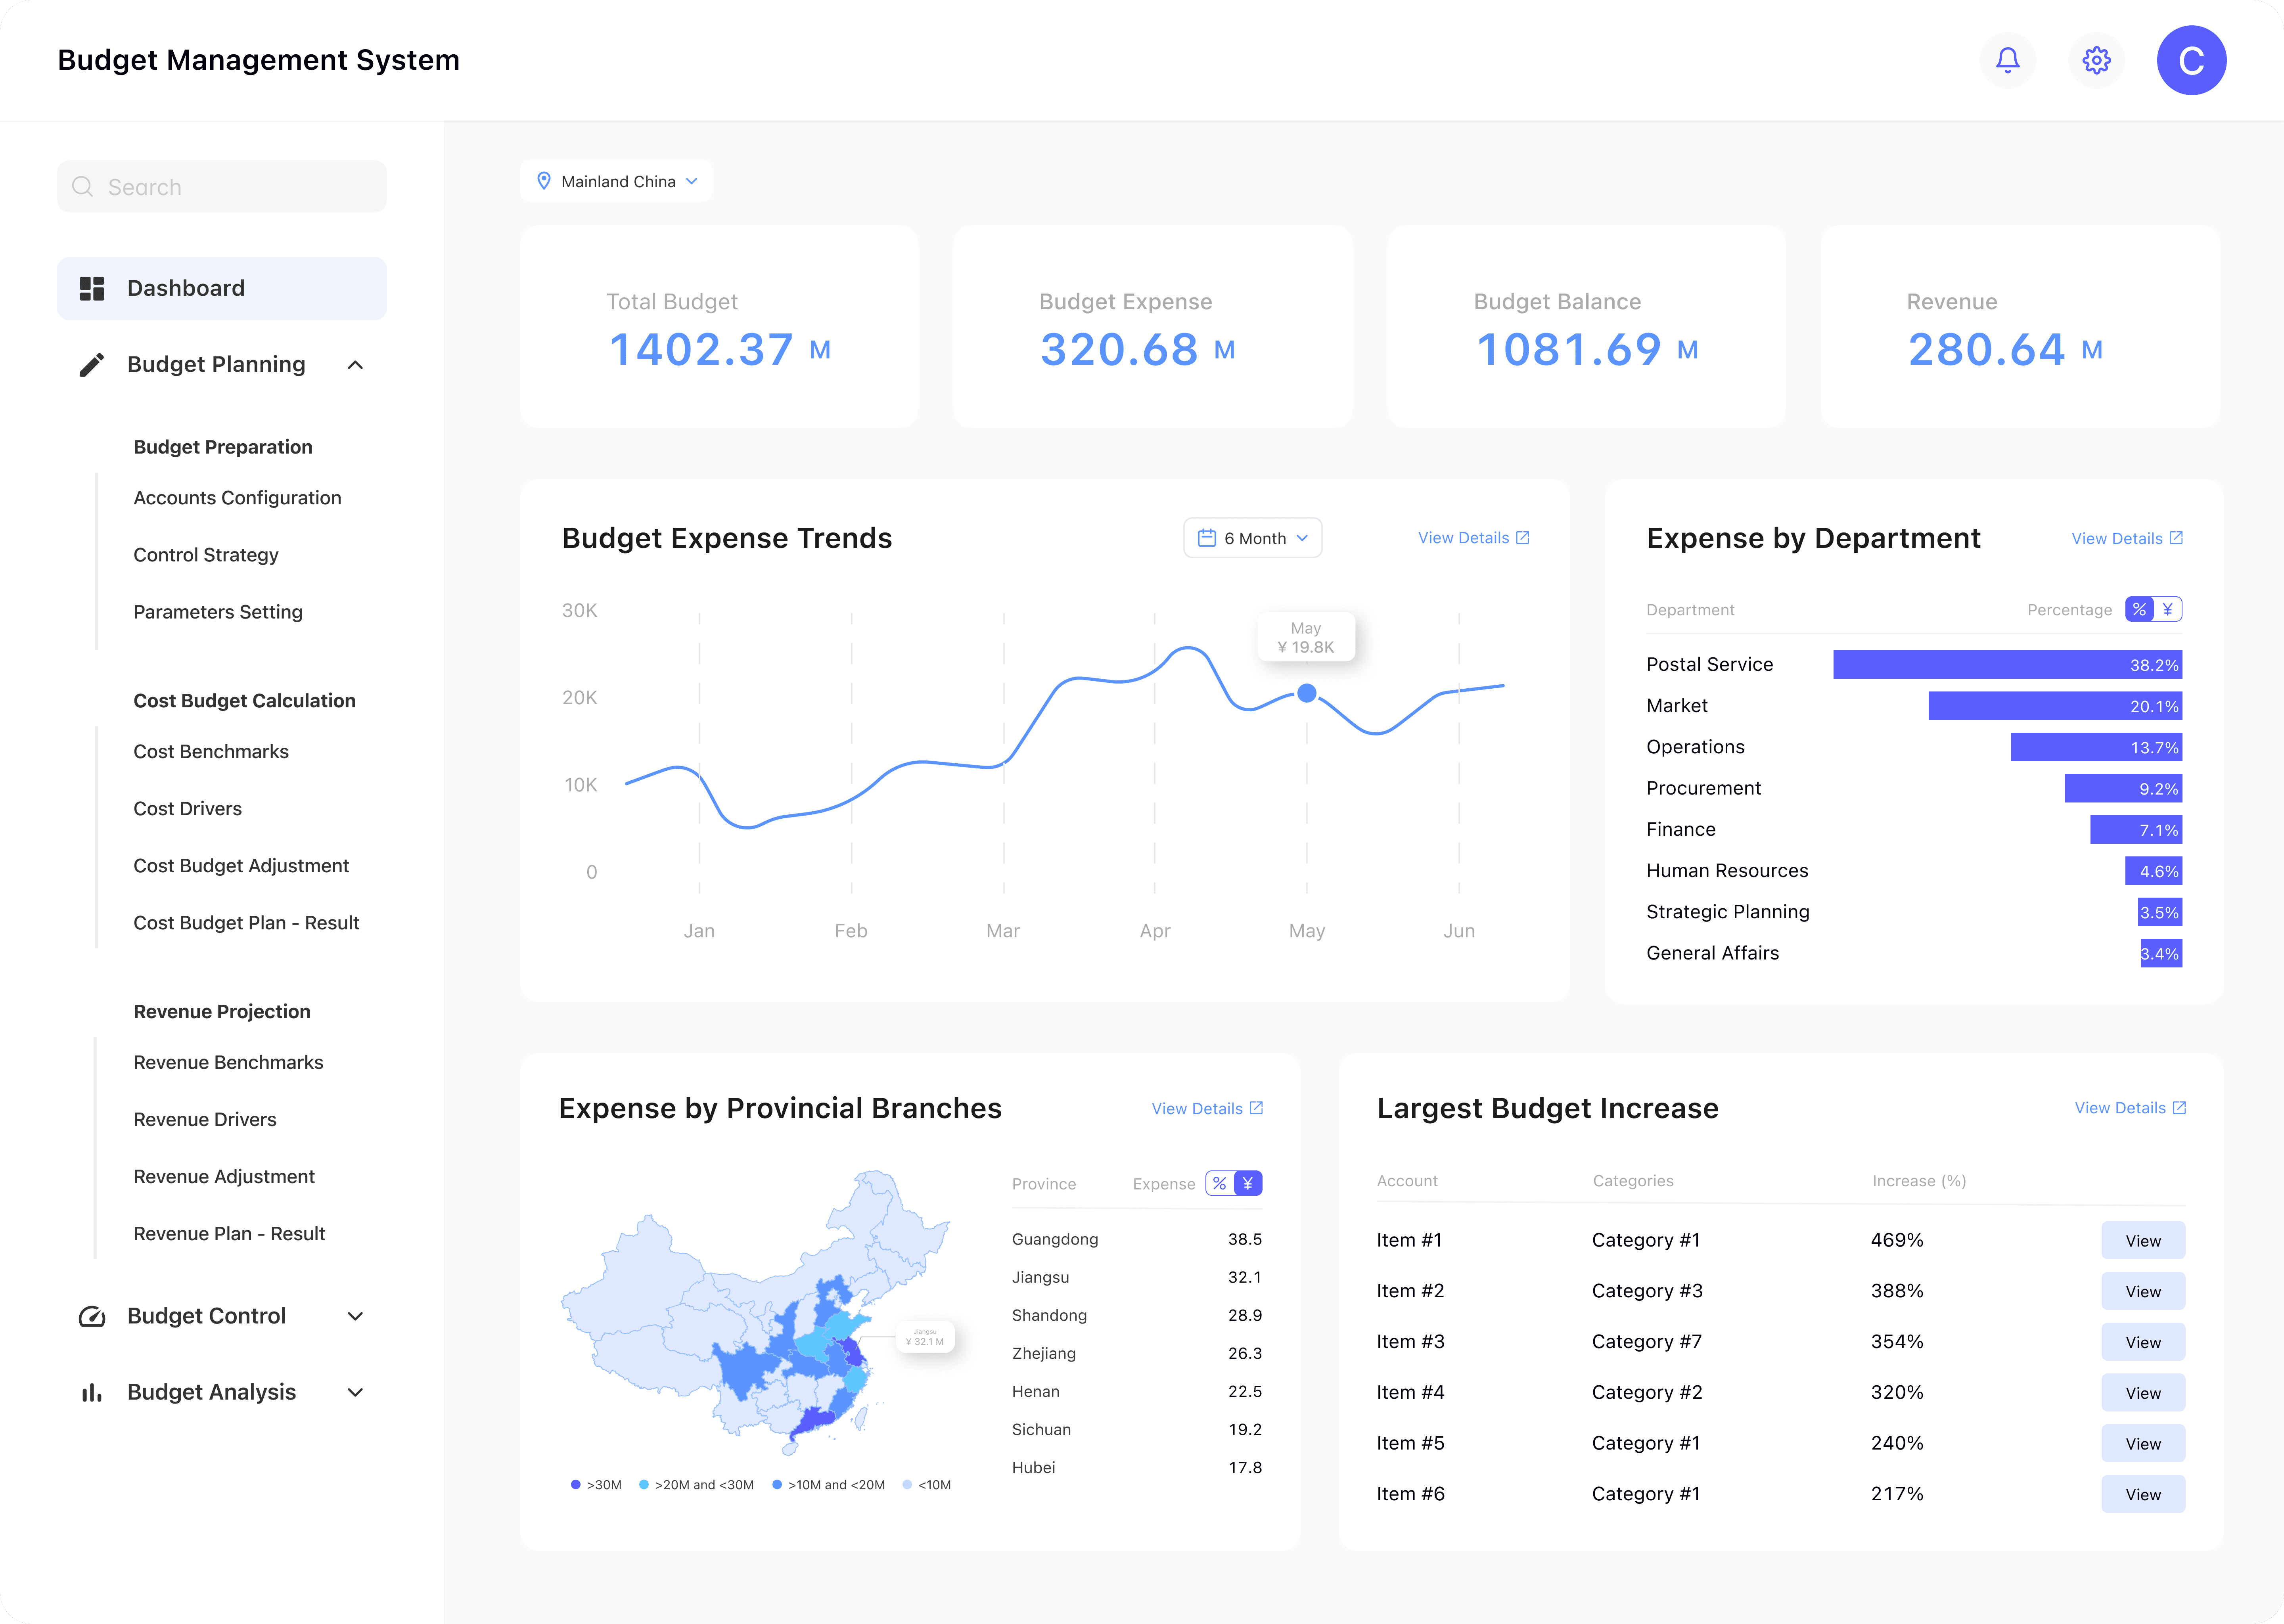
Dashboard
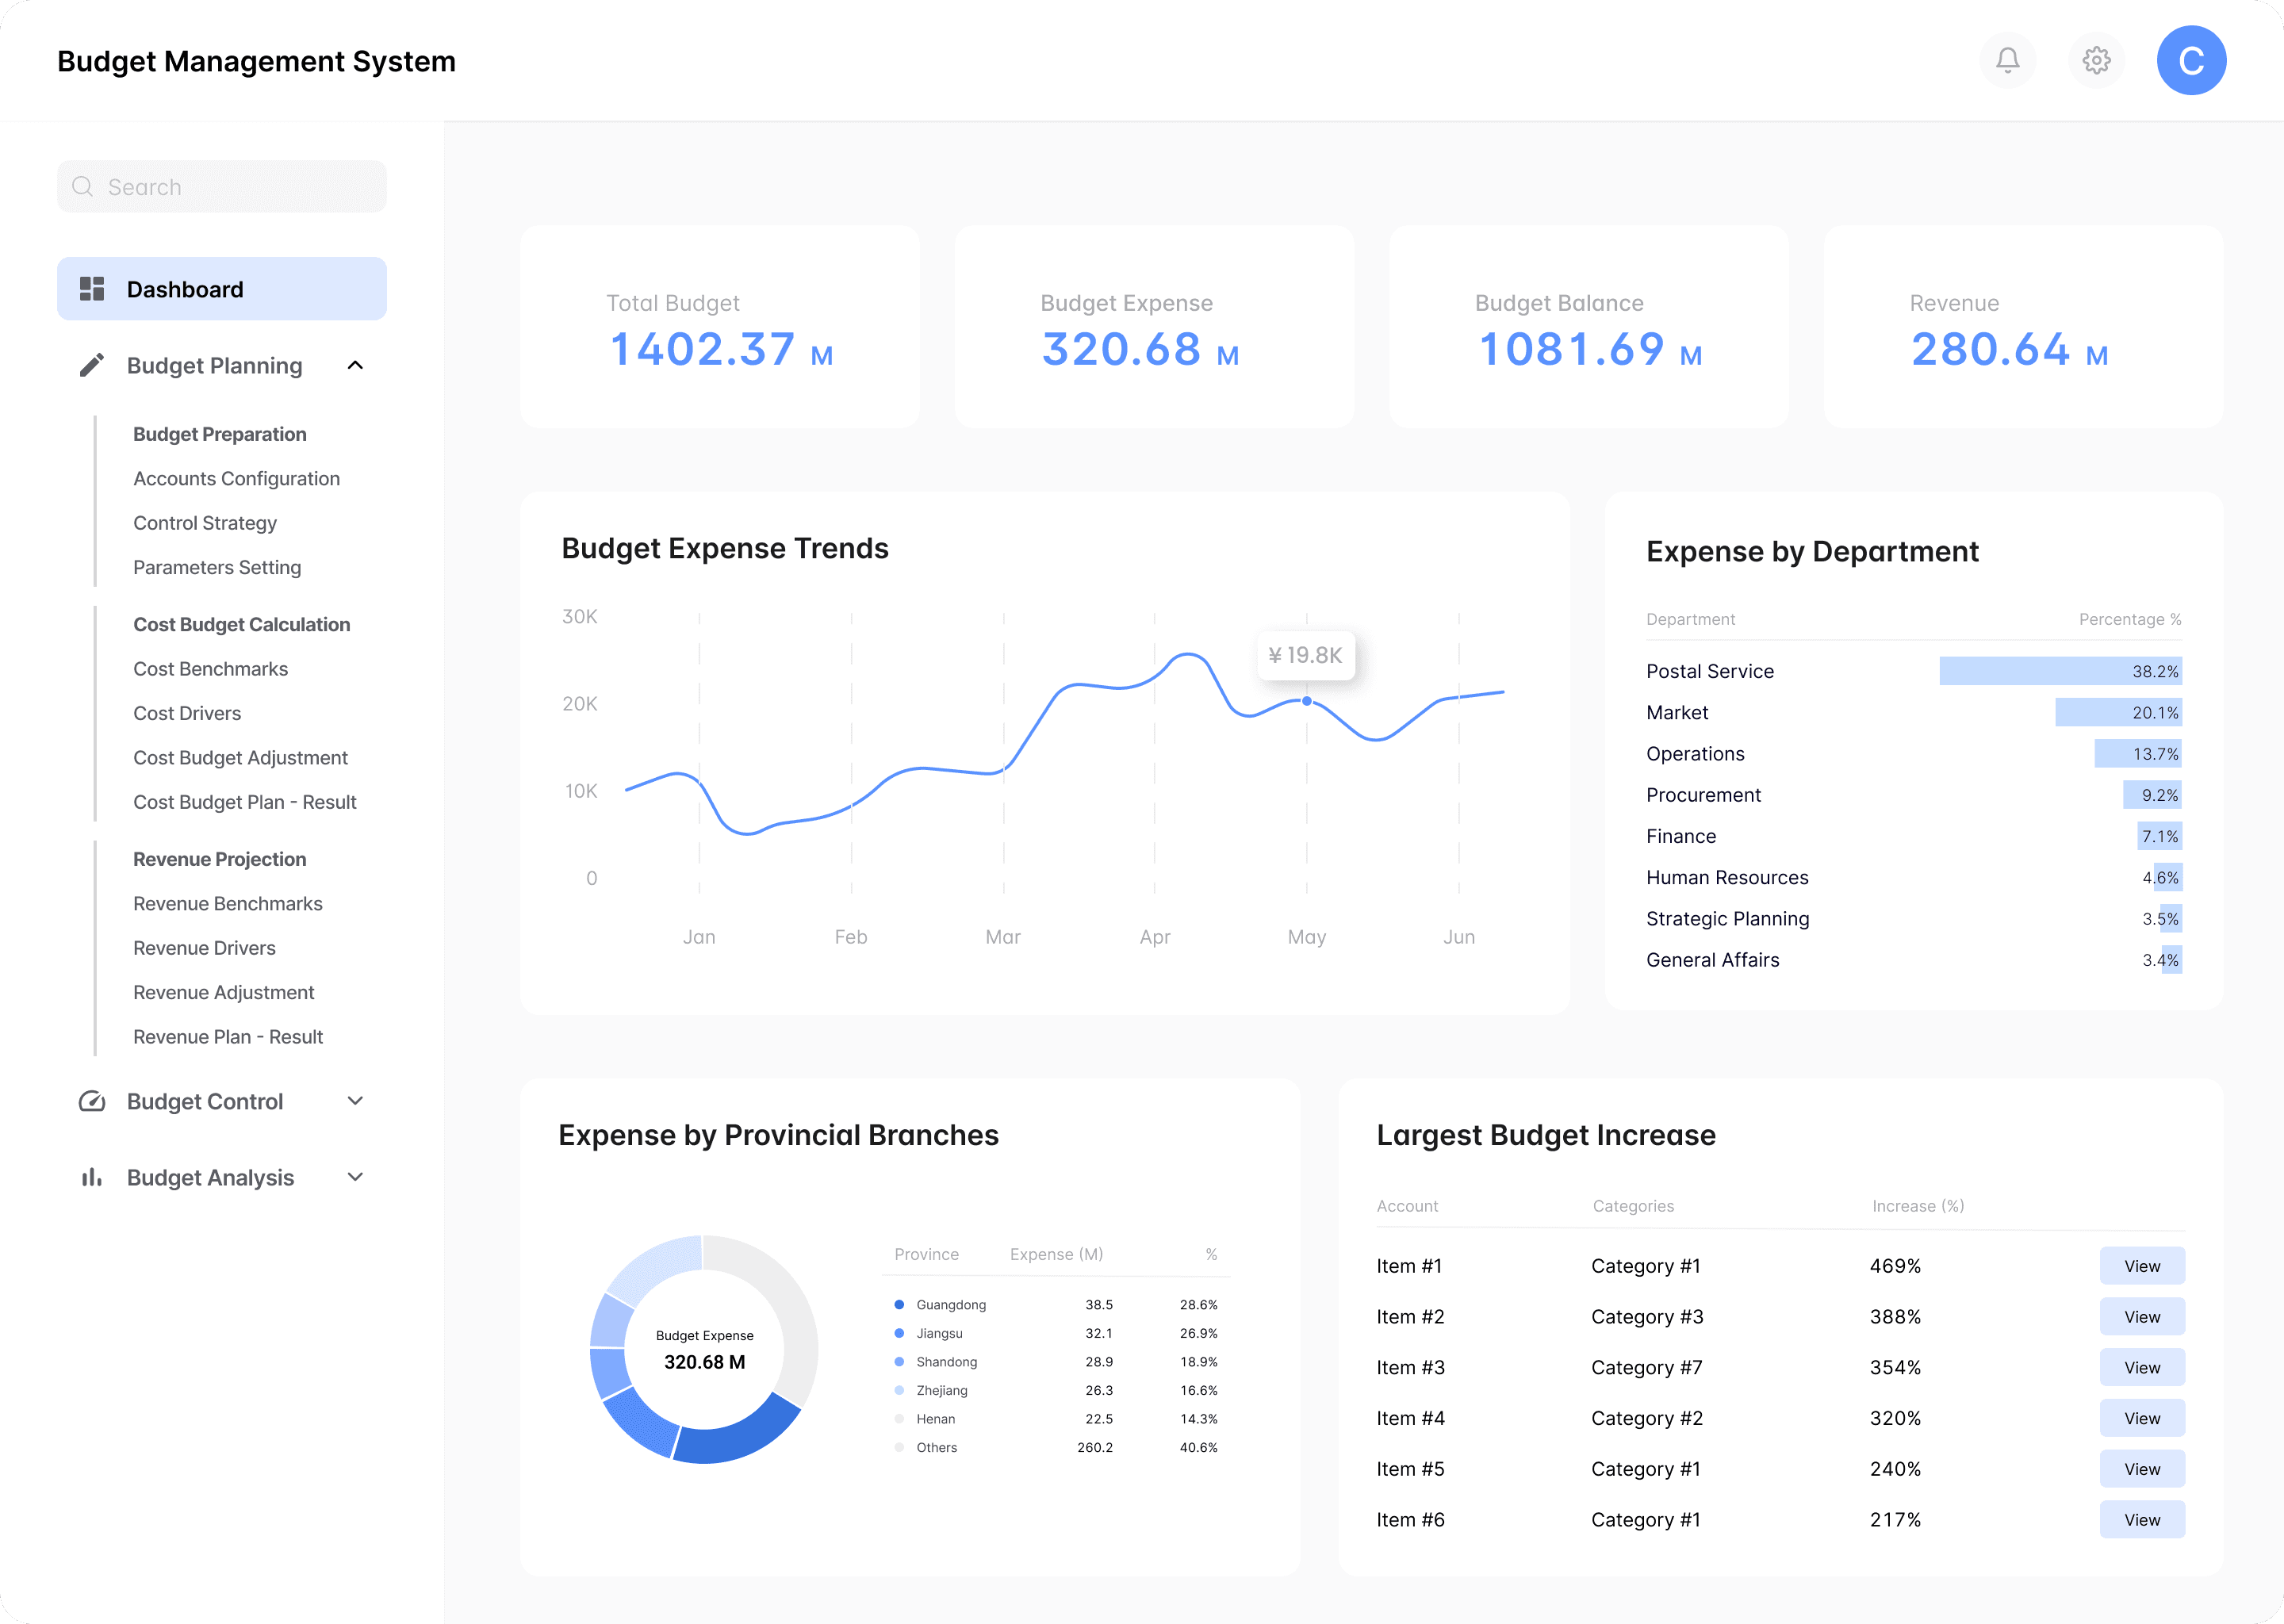
Findings:
Participants desire direct navigation from the dashboard to related detailed pages.
Participants want both amount and percentage display for departmental expenses.
Participants seek flexible timeframes for Budget Expense Trends.
Participants desire more efficient provincial expense visualization.
Corporate-level participants require customizable provincial data views
Handoff
Delivered the product.
Deliverables

Interfaces
Reflection
Measure the effectiveness of the Budget Management System.
System-related Metrics
Time Saved
Compare the time taken for budget preparation before and after system implementation.
Reporting Efficiency
Measure the time taken to generate standard budget reports and compare with current baseline.
Error Reduction
Monitor the number of budget revisions or corrections required pre- and post-implementation.
User Satisfaction
Conduct regular user surveys and track Net Promoter Score (NPS) over time.
Business-related Metrics
Financial Performance Improvement
Monitor key financial ratios like operational profitability before and after system implementation
Financial Decision-Making Speed
Measure the time taken from budget request submission to final approval, comparing it with historical data
Cost Control Effectiveness
Track the percentage of departments staying within their allocated budgets compared to pre-implementation figures
Return on Investment (ROI)
Calculate the financial benefits of the new system (cost savings, efficiency gains) against its implementation costs over a defined period
Key Takeaways
Complexity of Large-Scale Systems
Through this project, I learned the complexities involved in designing a system for a large corporation like China Post. I discovered the value of phased implementation, which allowed us to manage the project's scale effectively and make iterative improvements. This approach helped in tackling the diverse needs across multiple organizational levels and geographical regions.
User-centered Design
Engaging with stakeholders through interviews and user testing was vital in creating a system that truly met the needs of its users across different roles and departments.
Collaboration with the Engineering Team
I learned the significance of flexibility in design solutions, adapting our ideas to technical constraints without compromising functionality. Creating comprehensive documentation and project artifacts deepened my understanding of the organization's complex needs.
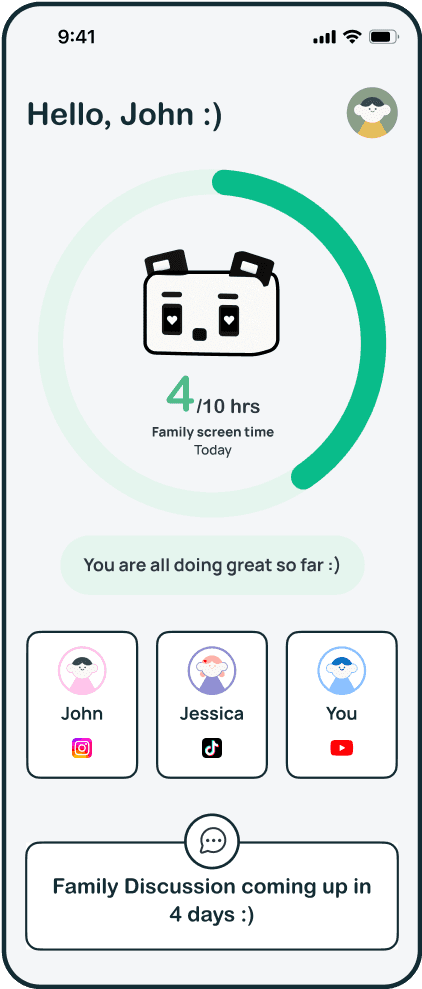
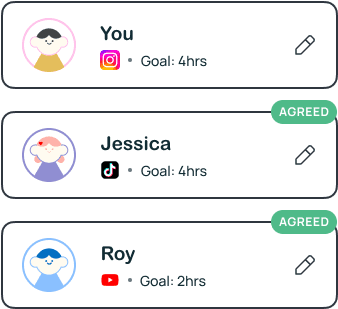
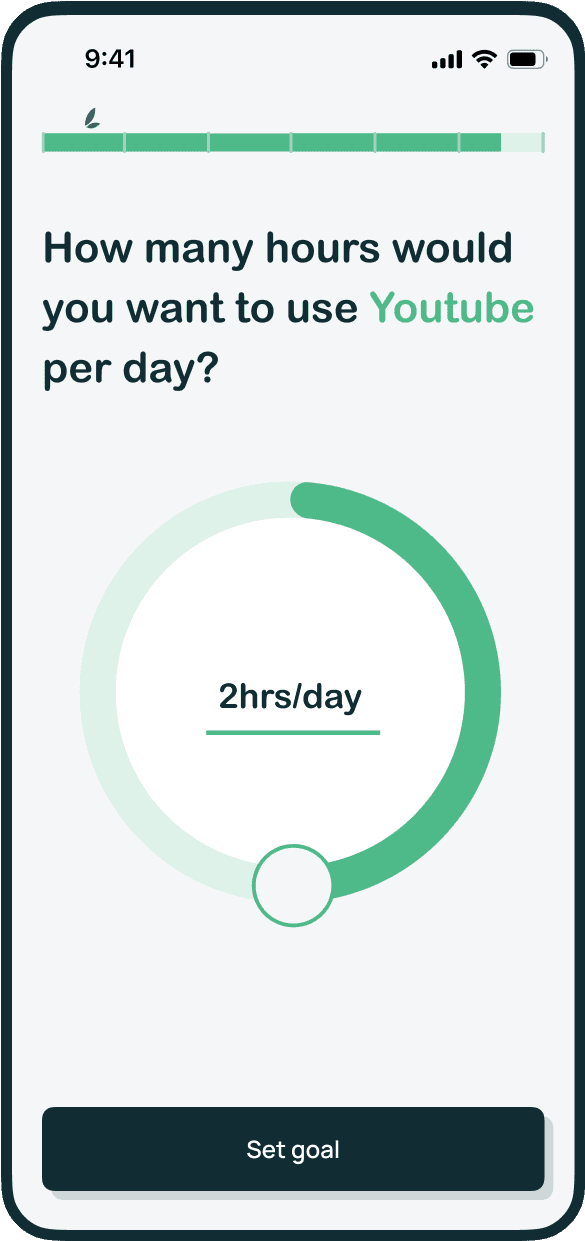
POPO
A family-centered solution to develop long-term healthy personal device use habits for families with tweens.
See case study


C / C

